By: The Pottawatomie County Economic Development Corporation (PCEDC) | 8.05.24
As Pottawatomie County moved through the second quarter, there was an increase in home sales and building permits. This trend aligns with previous years, where spring and summer months typically see more home sales compared to earlier in the year. The year-to-date sales and use tax totals for 2024 are also comparable to last year’s figures, suggesting stable retail activity across the county.
Download a printer-friendly version of the Q2 report.
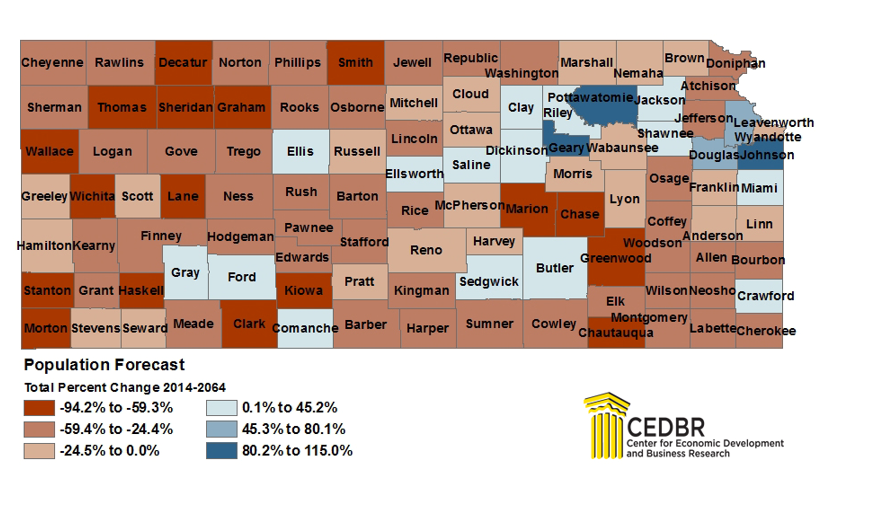
Pottawatomie County Growth Projections
Following growth projections, which suggest Pottawatomie county will grow to over 36,000 people in 2044, Pottawatomie County has remained one of the fastest growing counties in the state.
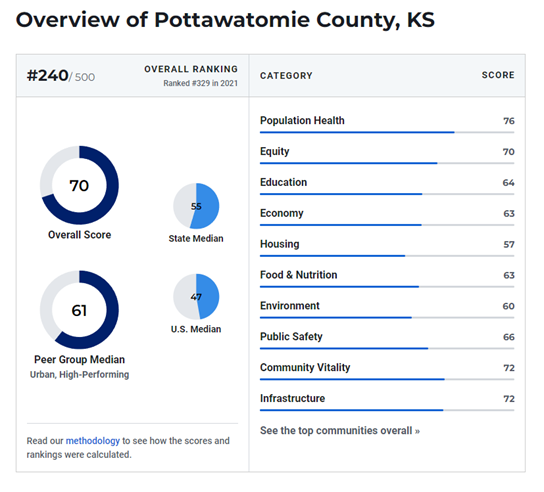
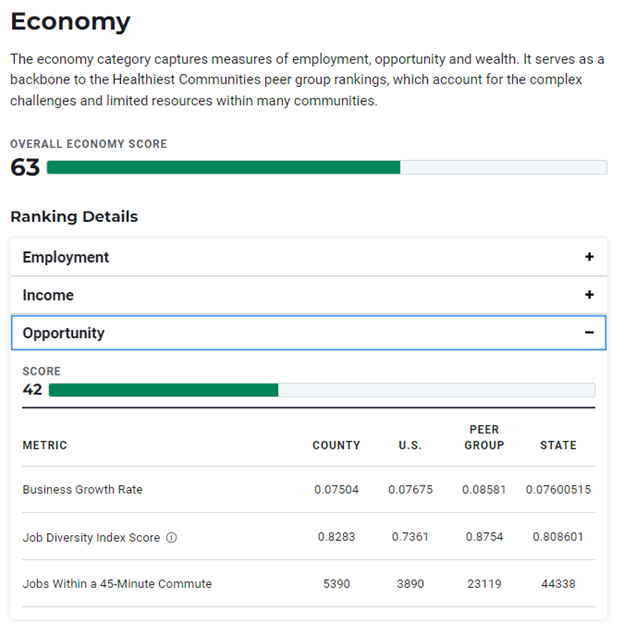
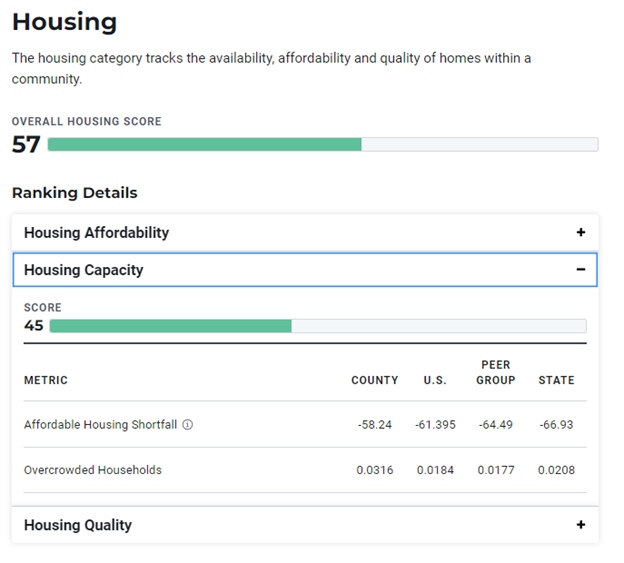
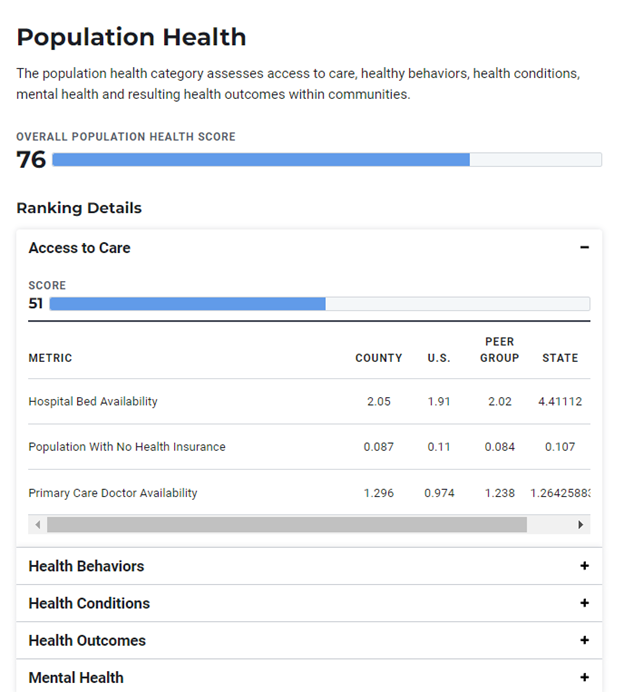
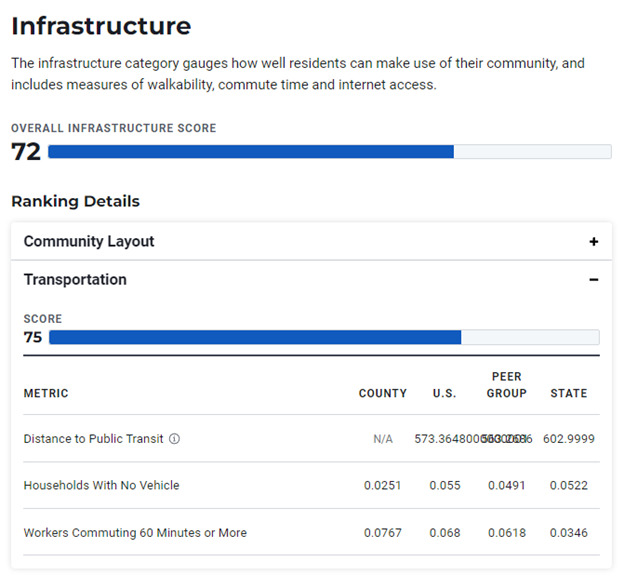
Pottawatomie County Community Indicators
On an ongoing basis, U.S. News compiles data and ranks the healthiest communities in the United States. The Healthiest Communities rankings from U.S. News & World Report show how nearly 3,000 U.S. counties and county equivalents perform in 89 metrics across 10 health and health-related categories.
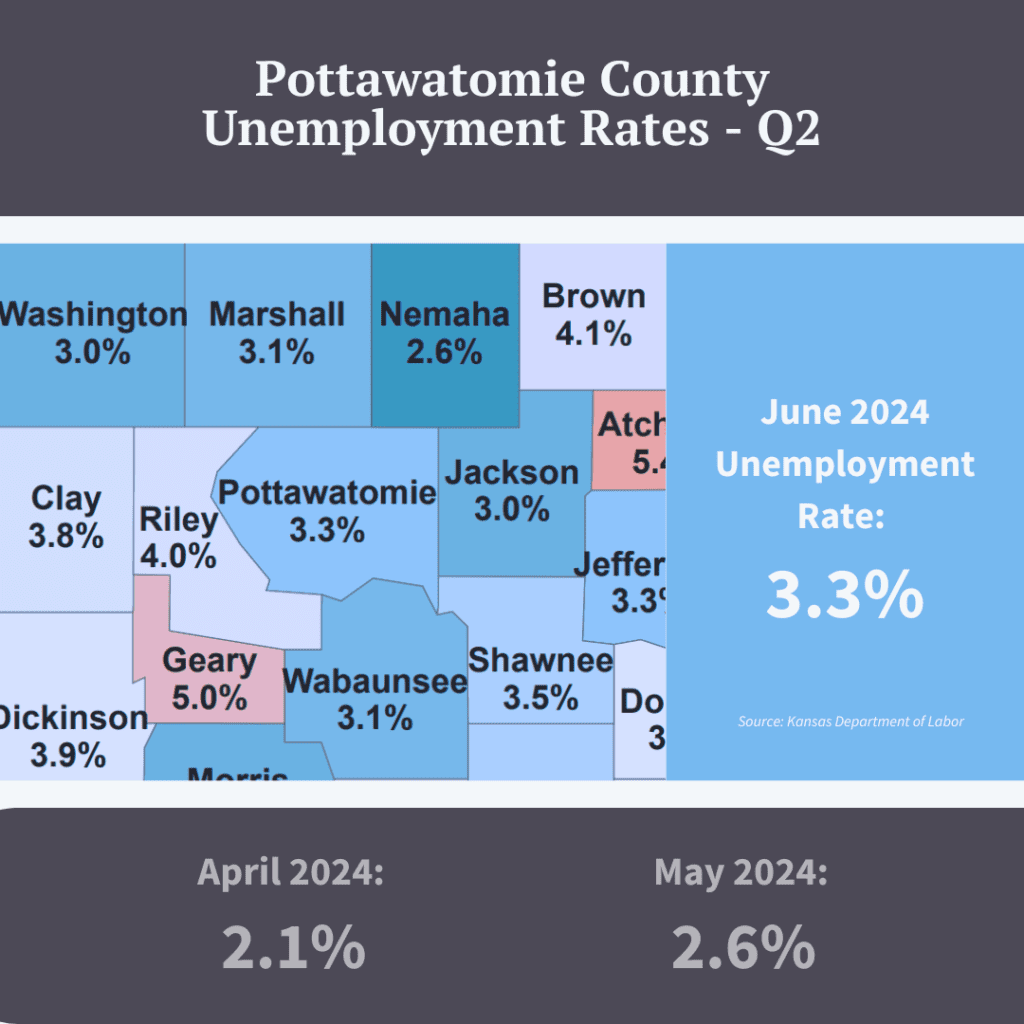
Pottawatomie County Employment & Workforce
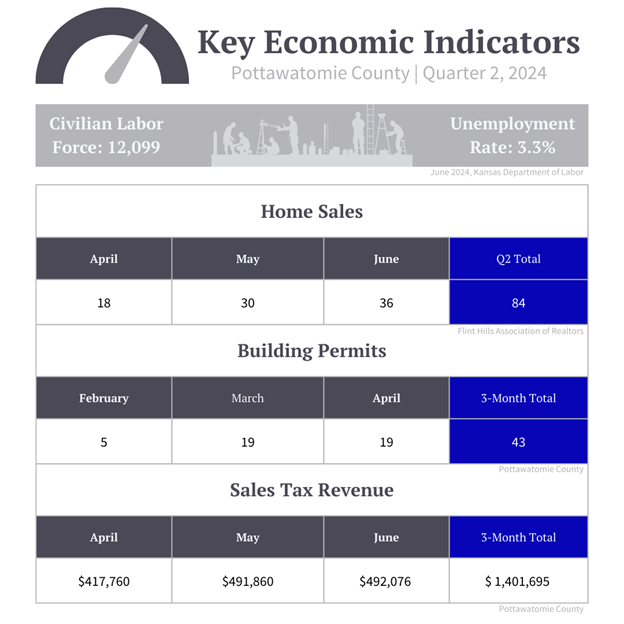
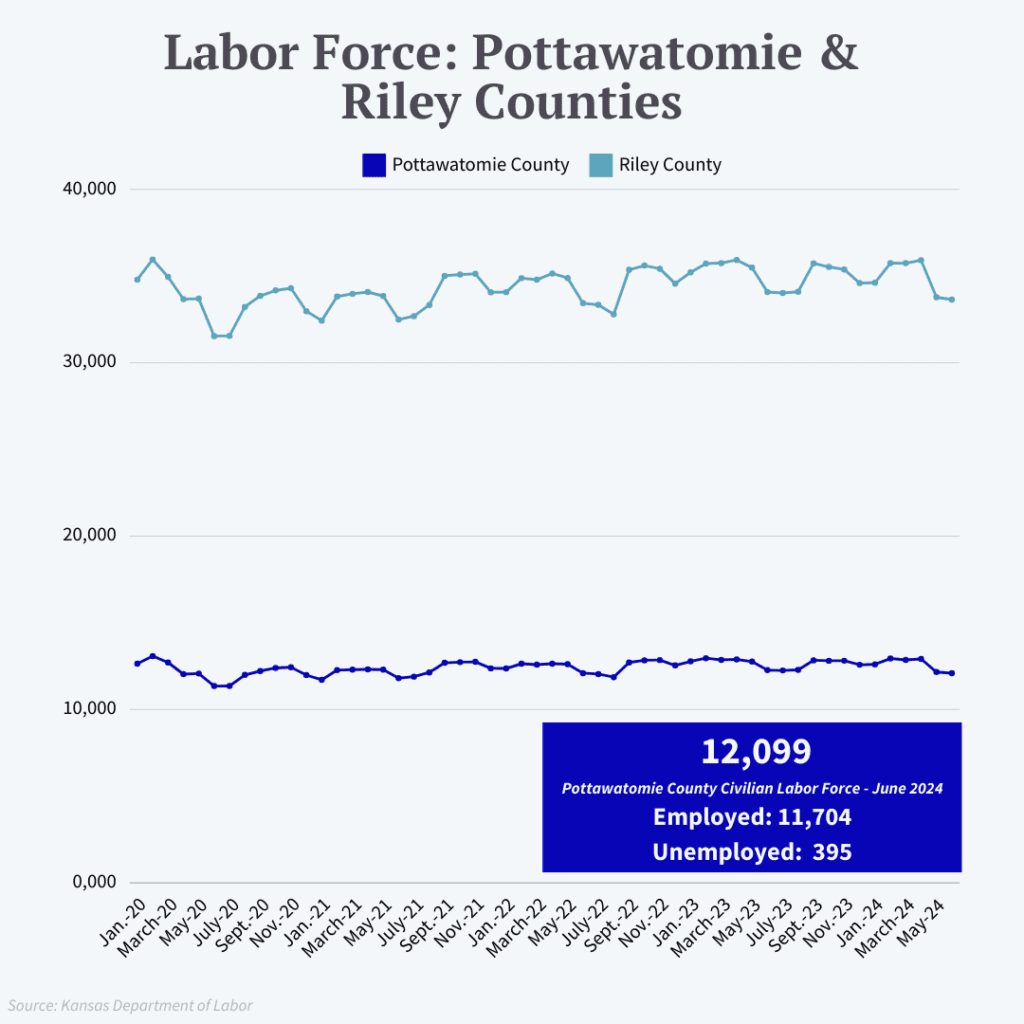
The Pottawatomie County unemployment rate jumped up several points, reaching 3.3% in June of 2024, but remained below the state average of 3.7% during the same month. The labor force has decreased significantly in the past several months as well – dropping to 12,099 in June from around 12,863 this past March; this marks a relatively large fluctuation in the labor force during the quarter, although in June of 2023, the county labor force was 12,269, so the year-over-year change is not as drastic. A time-series graph of the Pottawatomie County Labor Force reflects a general pattern of regular fluctuations, albeit mostly smaller in size:
Although not likely a major source of impact to current labor force data (which is generally defined by the number of residents who are either working or actively looking for work), a notable source of labor-related stresses and upcoming change for Pottawatomie County is Caterpillar’s announcement to close their Wamego facility in 2025, a decision which is anticipated to impact some 300 workers. In light of this news, the PCEDC and other regional partners have begun transition efforts to help ease conditions for displaced workers, and start early-stage marketing efforts for the facility.
Pottawatomie County Sales Tax and Retail Sales Data
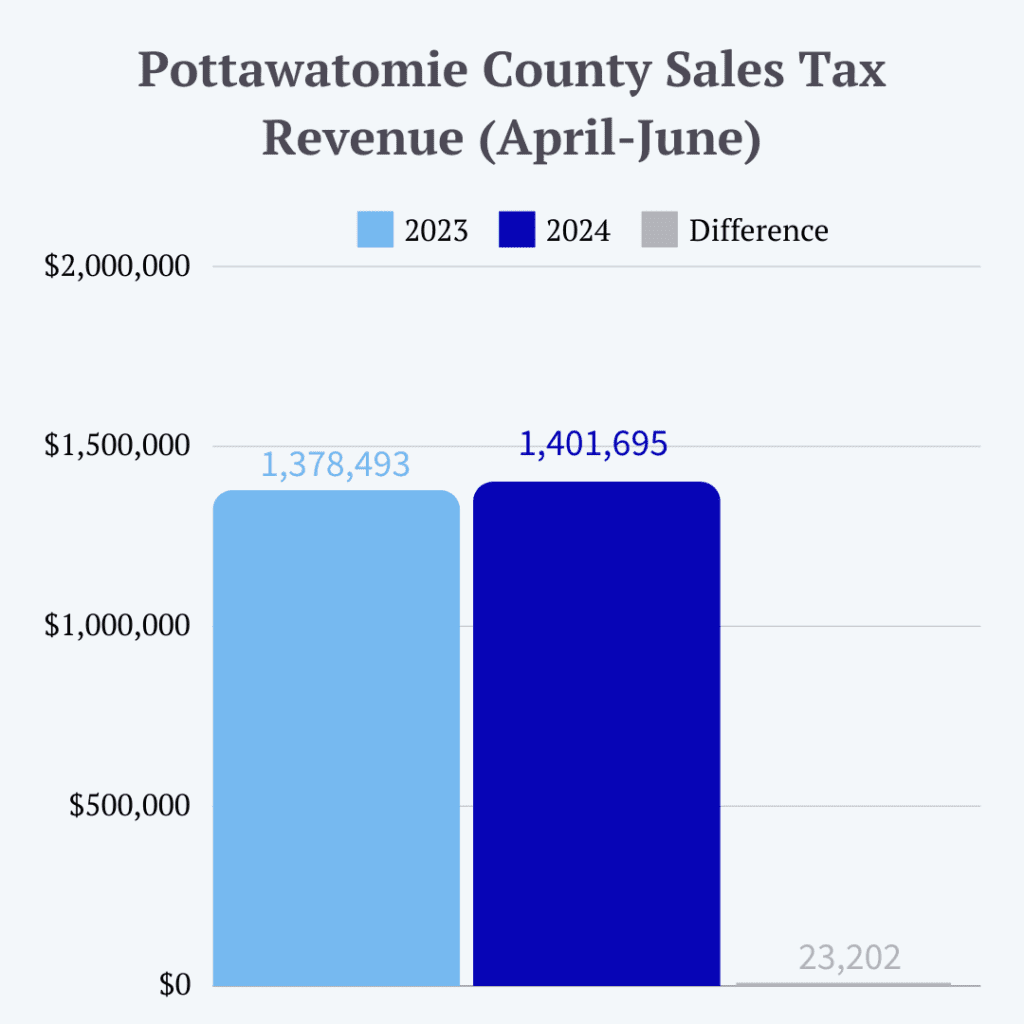
Sales and use tax revenues for 2024 mirror, but also slightly trail those from 2023 (when viewed by year-to-date totals; the total for Q2 of 2024 is slightly higher than the total for Q2 of 2023). This suggests a lack of significant growth in the retail market over the past year.
Pottawatomie County Housing Trends
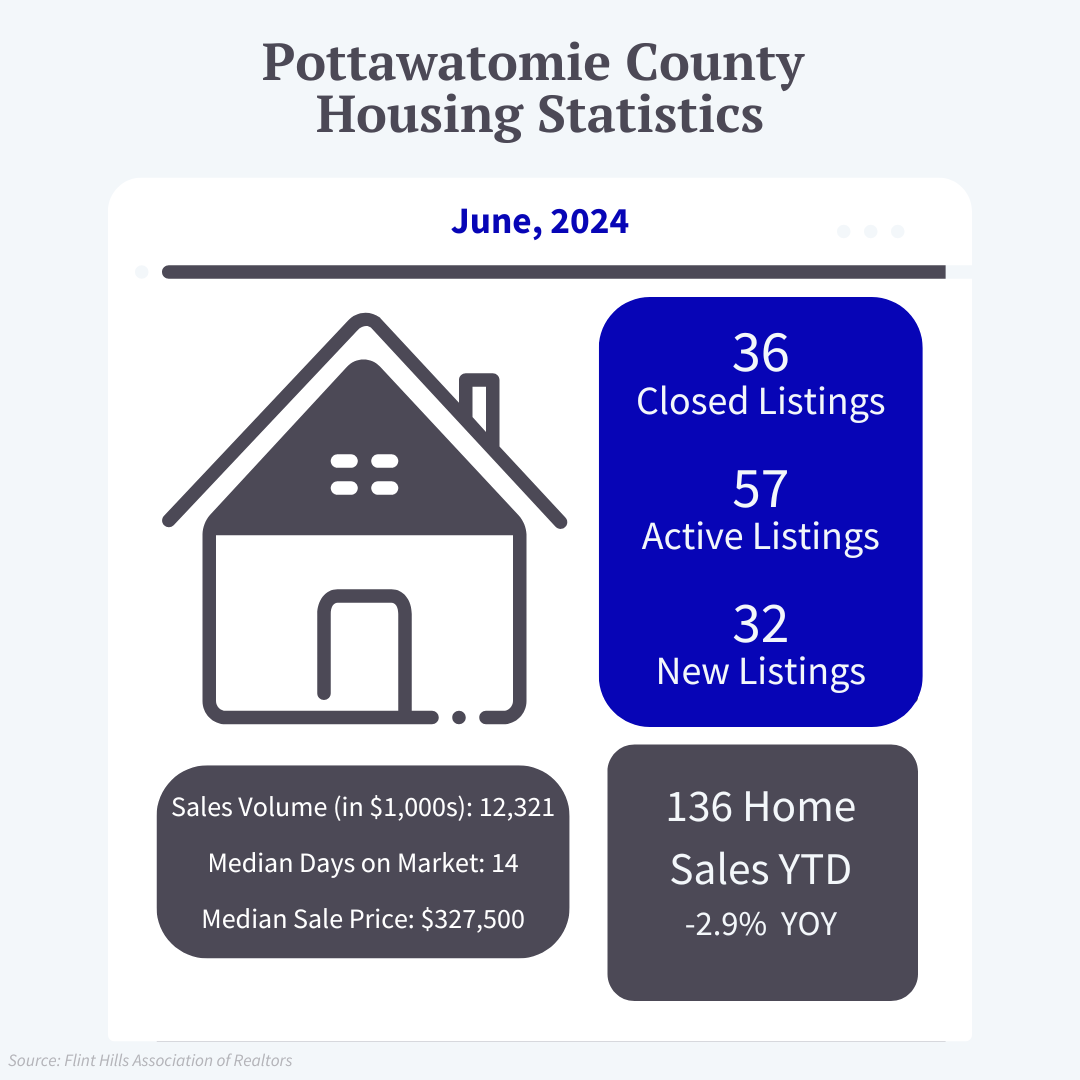
After prices ran lower during earlier months, the median home sales price for closed listings in Pottawatomie county rebounded back up to the range of prices we saw during most of 2023. In June, the median home sales price was $327,500, with an average number of days on the market of 25.
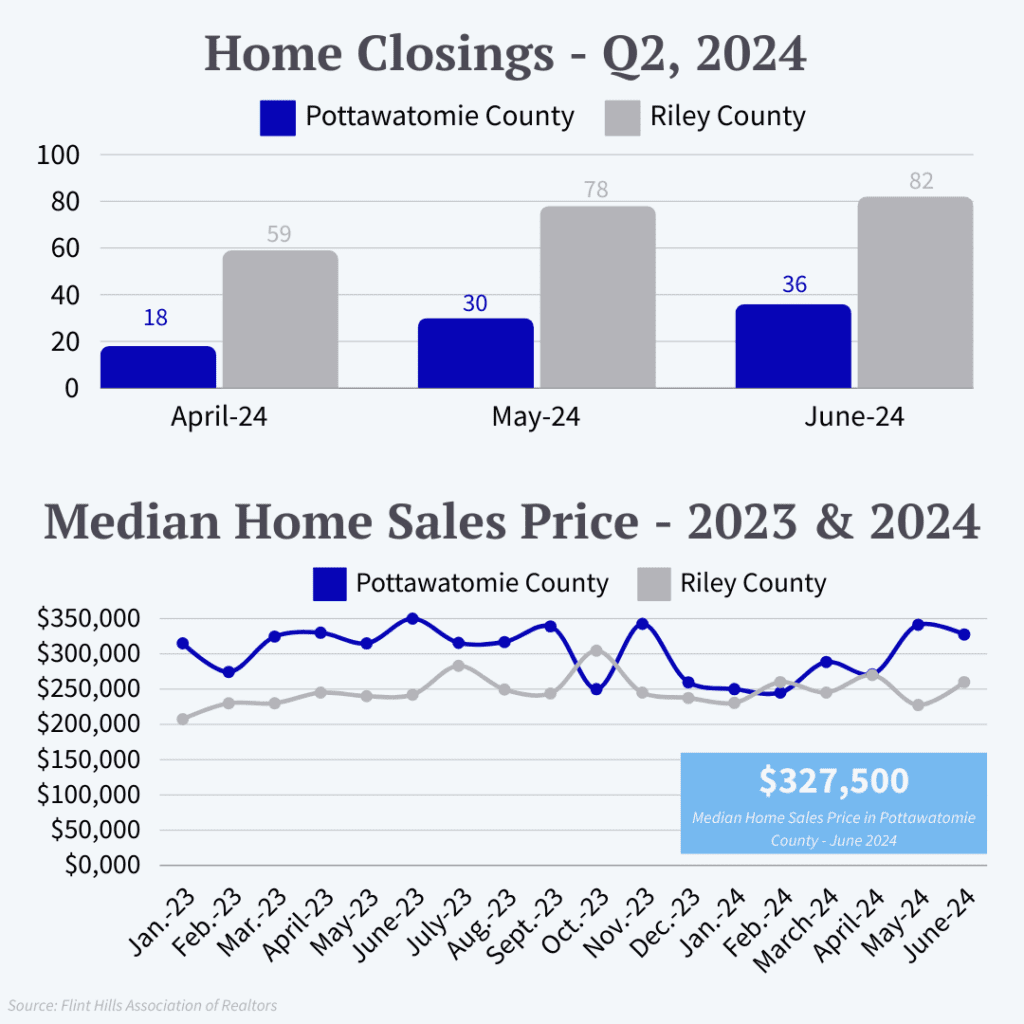
Progressing through Quarter 2, we saw increases in the numbers of home sales per month. This increase is likely attributable to seasonality, as Pottawatomie county’s number of closed listings have generally been highest in the spring and summer months during recent years.


In terms of building permits, the quarter started with the issuance of 10 new permits for dwellings in April. This contributes to a total of 19 new permits issued in Pottawatomie county during April of 2024. This total is the same as during April of 2023, according to county data on permits.
National & Global Concerns
Layoffs by Industry
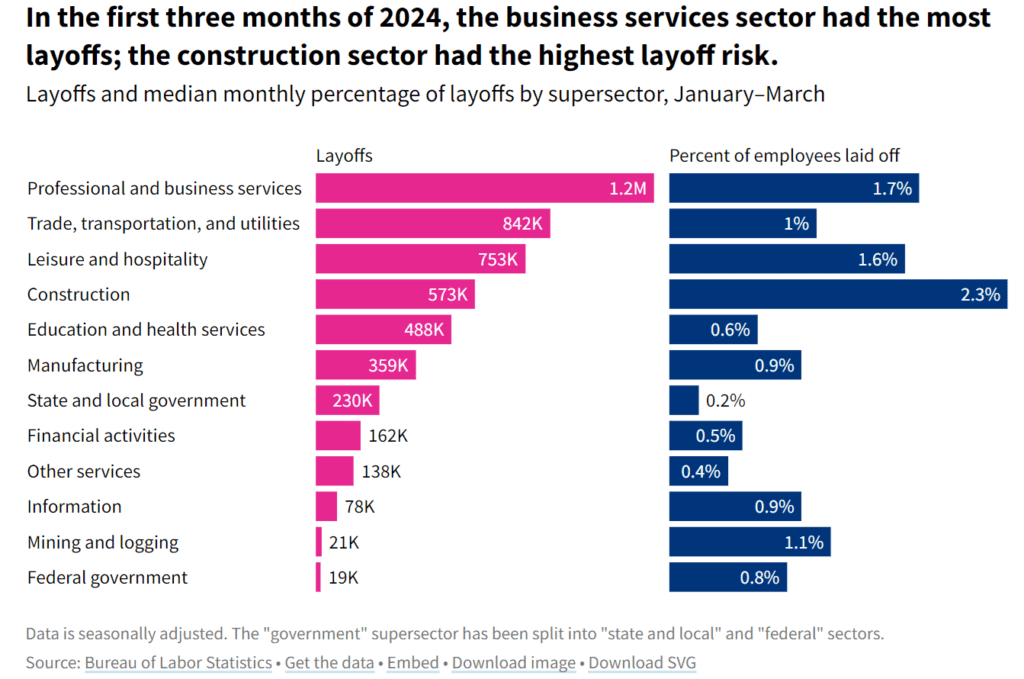
According to USA Facts, 1.2 million of the 4.9 million layoffs in the first three months of the year were in the professional and business services sector, while workers in construction faced the highest risk of layoffs.
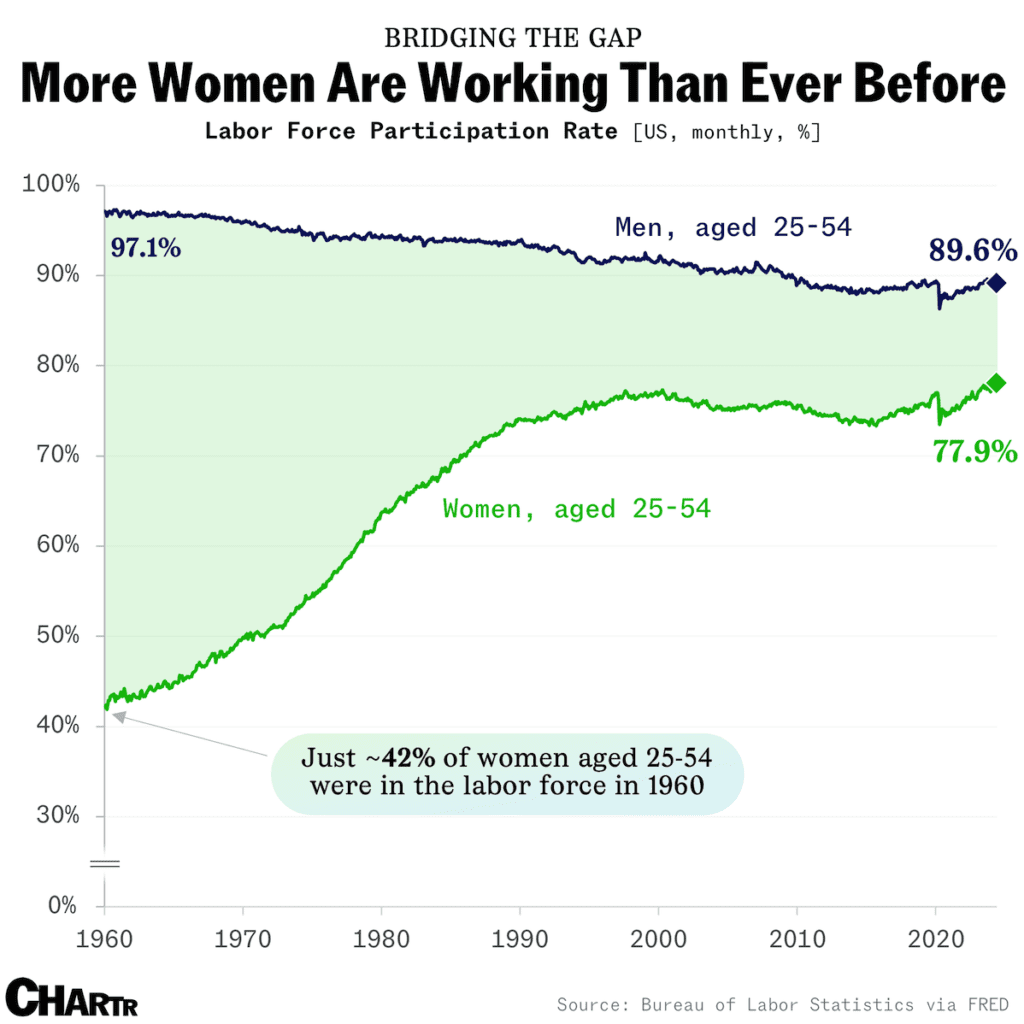
Workforce Changes – More Women in the Workforce
According to Chartr/Sherwood news, the amount of females in the U.S. workforce reached an all-time high (of 78.1%) in May of 2024. This follows a general trend of growth in the female workforce over the past several decades, and indicates that women hold around 79 million jobs nationally.
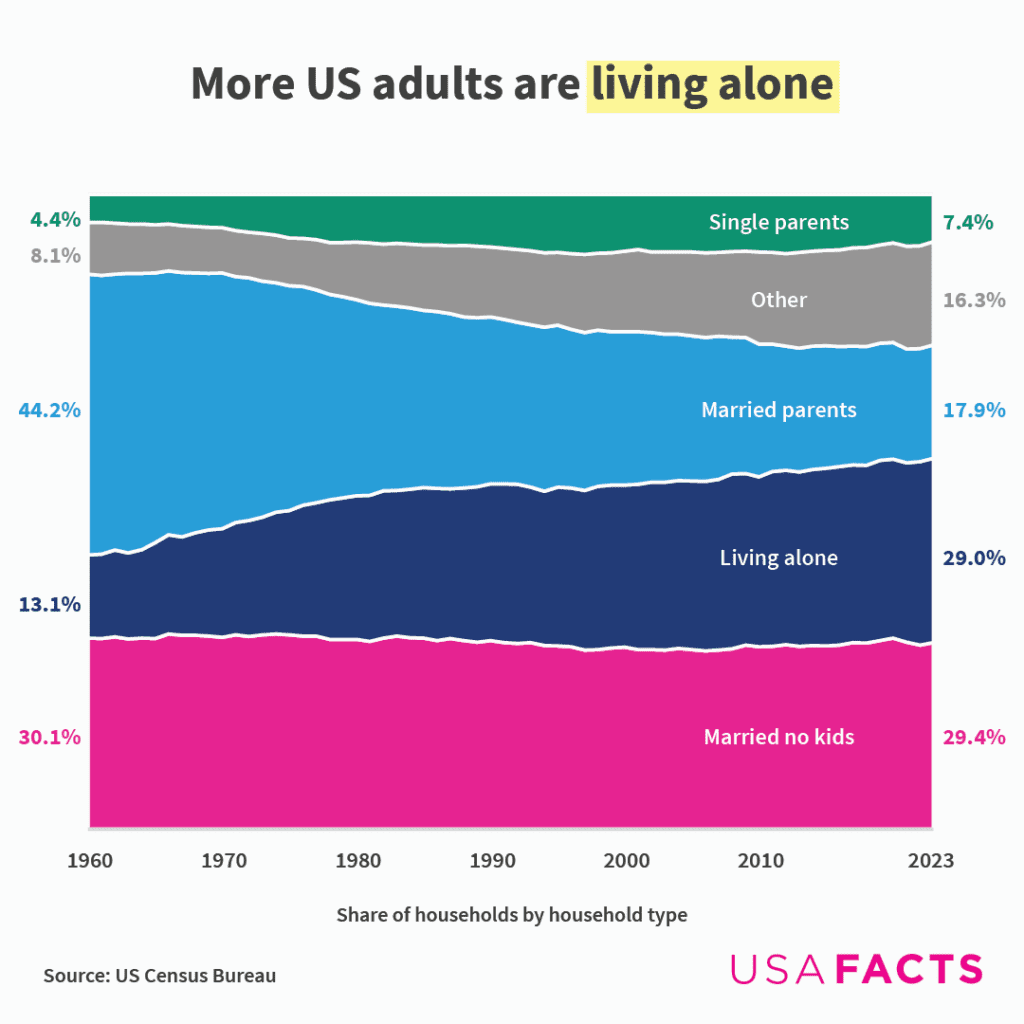
Shifting Households – More U.S. Adults Living Alone
Pertinent to lifestyles and residential housing data, USAFacts identified a trend of more adults living alone in recent years than in the past. This national shift may have implications for the residential real estate market over coming years.
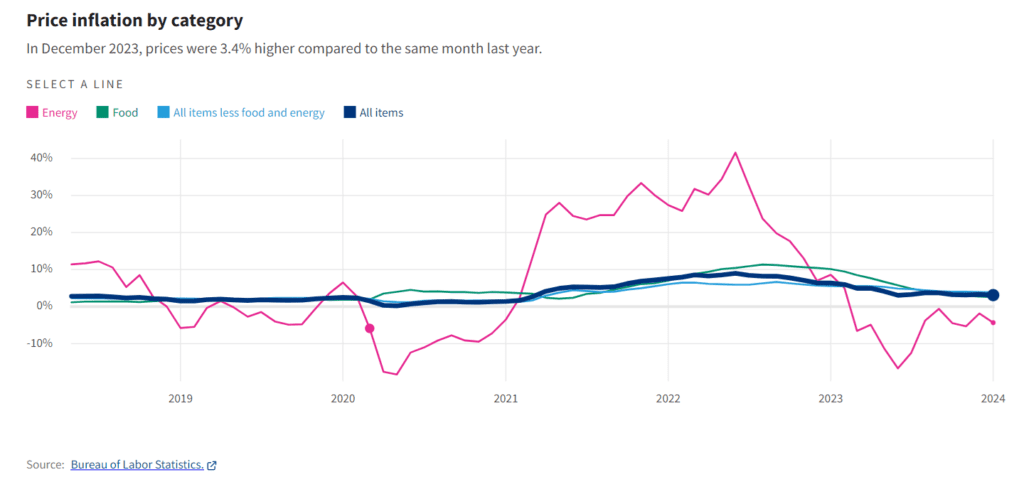
Inflation Trends by Price Category
In an overview of price inflation by category, USAFacts reports that, in December of 2023, prices were 3.4% higher than during December of 2022. The chart below shows the shift of inflation by category over recent years, providing a visualization of the volatility of certain markets, namely food and energy, that are generally not included in core inflation calculations:
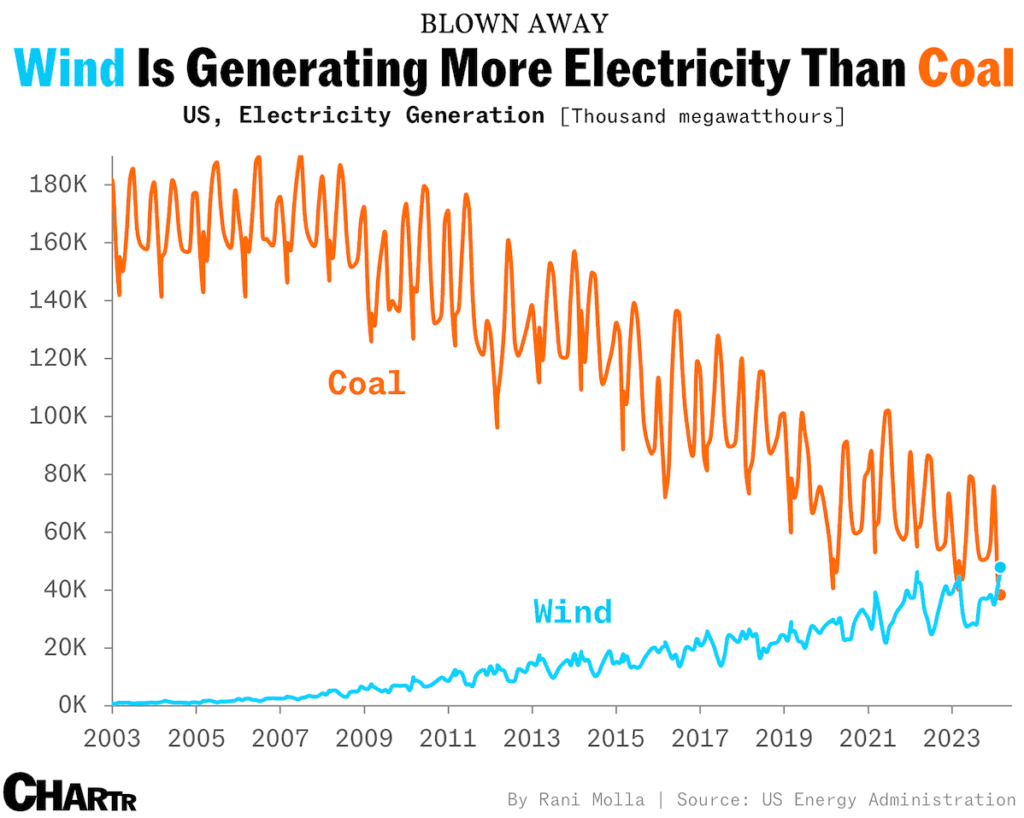
Energy Trends – Wind Production Surpassing Coal for Consecutive Months
Chartr/Sherwood News also reports that the generation of wind energy has surpassed coal for two months in a row this year. Amid this shift and the increased attention and investment around renewable energy, however, Natural Gas remains the primary fuel source across the country.