By: The Pottawatomie County Economic Development Corporation (PCEDC) | 11.11.24
Economic indicators for Pottawatomie county, including labor, housing, and sales tax data, generally followed trends from the previous quarter and quarter three of last year. Sales and use tax revenues saw a strong spike in July, reaching over $500,000, and helping to bump year-to-date sales and use tax totals slightly above totals for the same time in 2023. Meanwhile, Pottawatomie County’s unemployment rate (not seasonally adjusted) dropped from 3.6% in July to 2.7% in September.
Download a printer-friendly version of the Q3 report.
Pottawatomie County Employment & Workforce
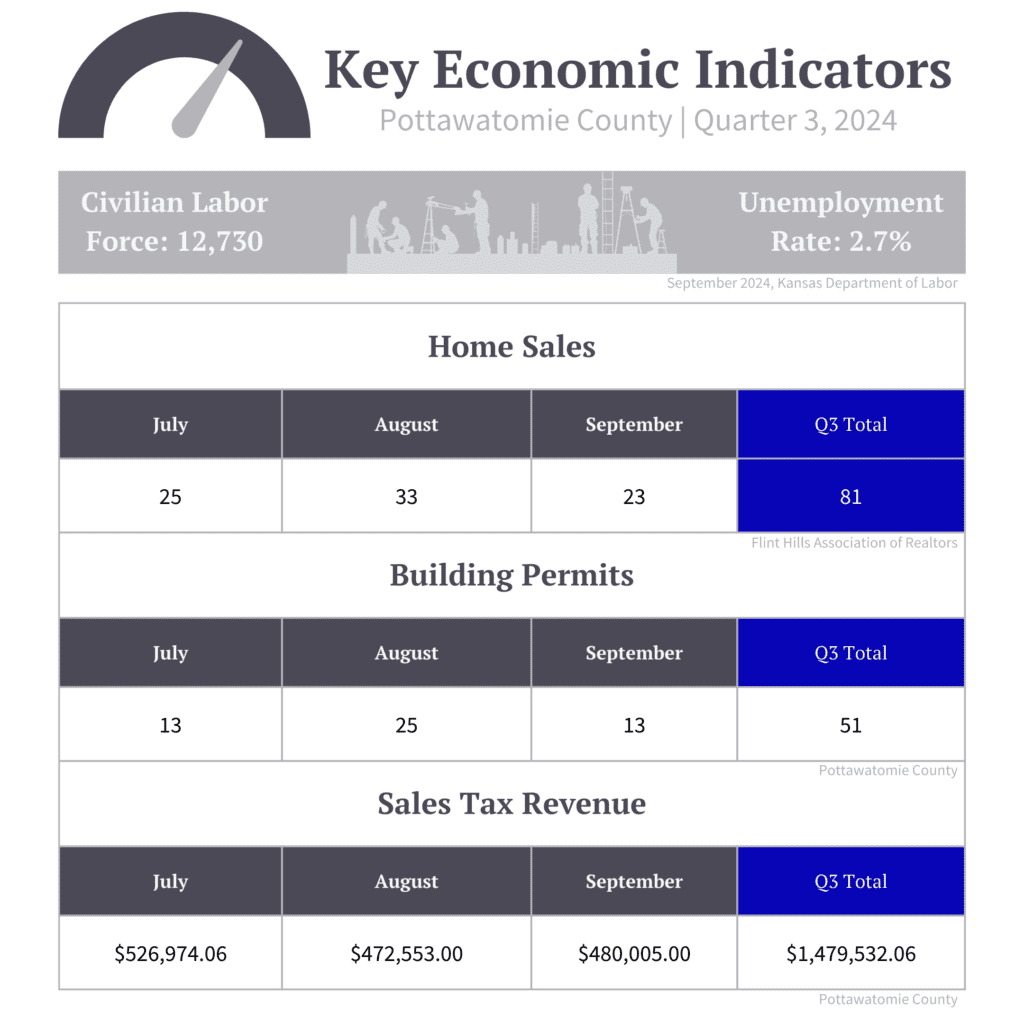
Pottawatomie County’s labor force remained within its standard range during quarter 2023, with 12,730 in September: this represents 12,380 employed and 350 unemployed individuals. The unemployment rate for the county dropped during the quarter, with September’s rate being just 2.7%, down from over 3% in both July and August.
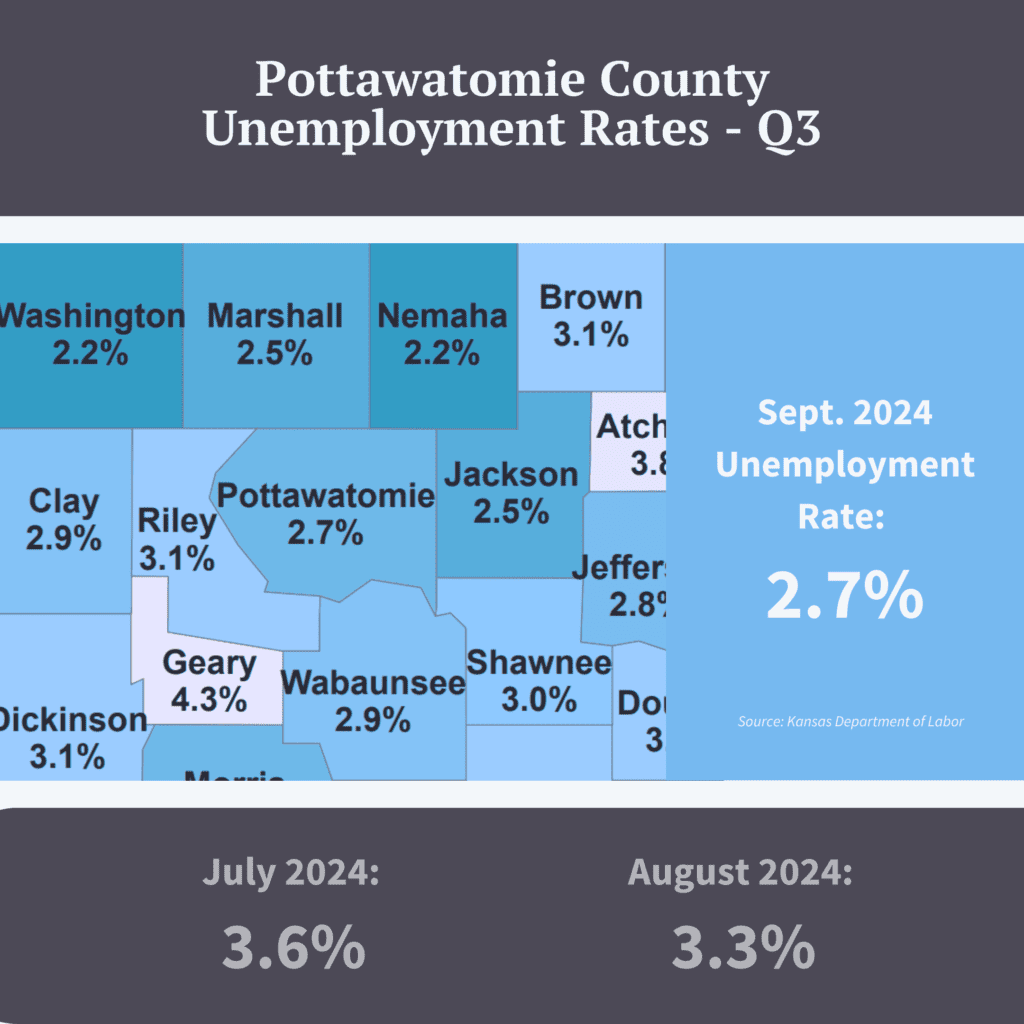
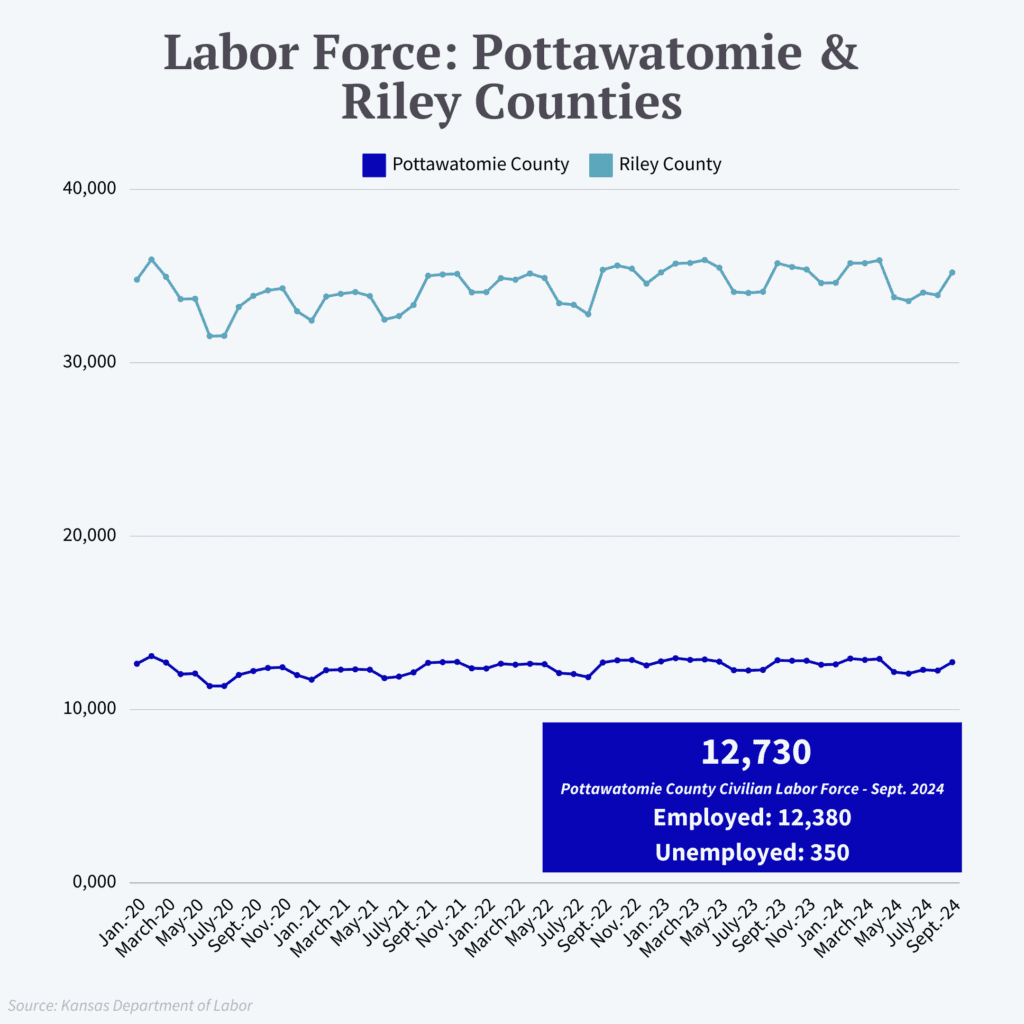
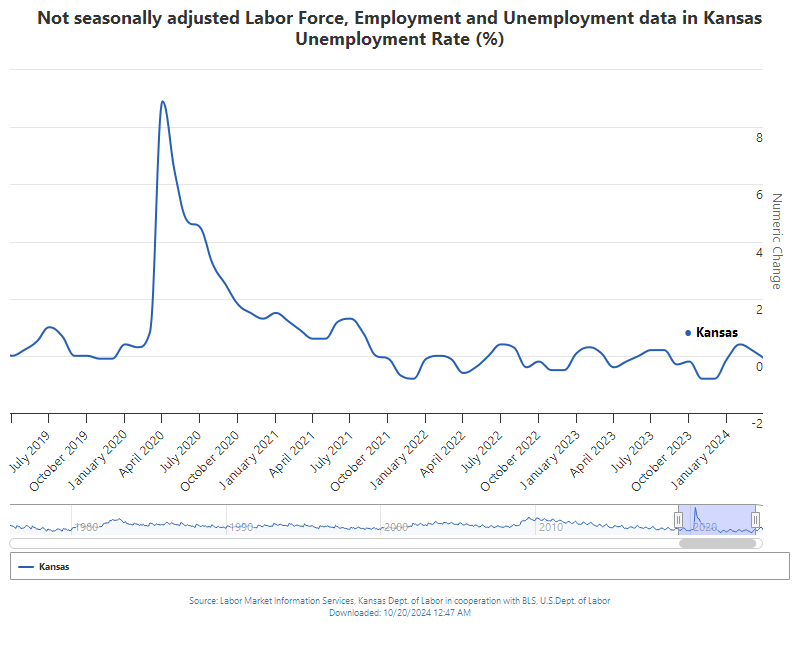
For context, both Riley County and the State as a whole saw a similar trend, with (non-seasonally-adjusted) unemployment rates decreasing as the quarter went on. While seasonally-adjusted data is not available through the Kansas Department of Labor on the county level, seasonally-adjusted data for the state tells a slightly more complex story, with the unemployment rate hovering at 3.2% and 3.3% throughout the quarter, suggesting that seasonal trends may be at play with large unemployment rate drops in quarter three. A look at the following graph, which shows the non-adjusted unemployment rates for the state over the past five years, generally reflects this seasonality as well, with cyclical peaks in unemployment during the early spring and mid-summer months:
Pottawatomie County Sales Tax and Retail Sales Data
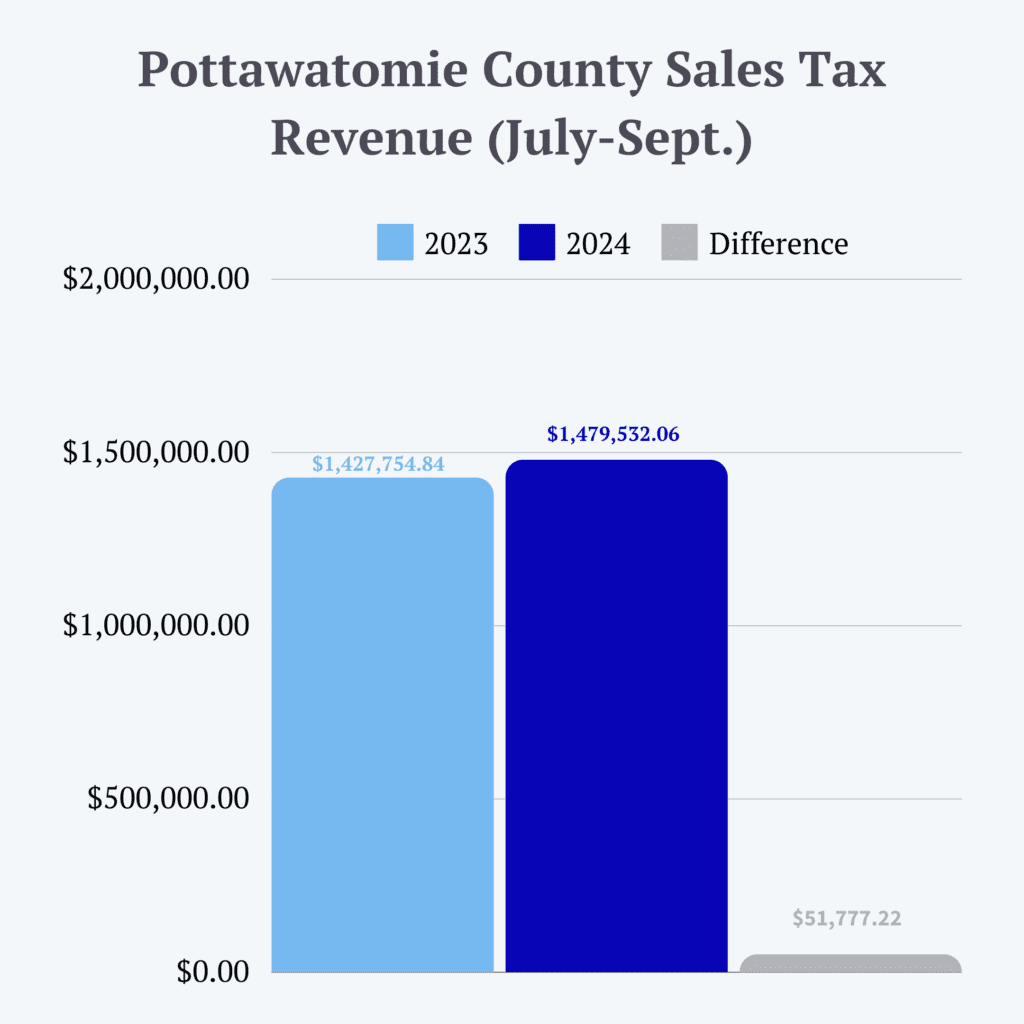
July was a strong month for sales and use tax in Pottawatomie County, with numbers for the month breaking the $526,000. August and September followed with less impressive, but strong numbers ($472,553 and $480,005, respectively), helping the county’s quarter three sales tax total outpace that same figure from last year. The year-to-date (through September) county sales and use tax total for 2024 is at $4,266,657, just larger than the $4,240,317 total for the same period in 2023.
Pottawatomie County Housing Trends
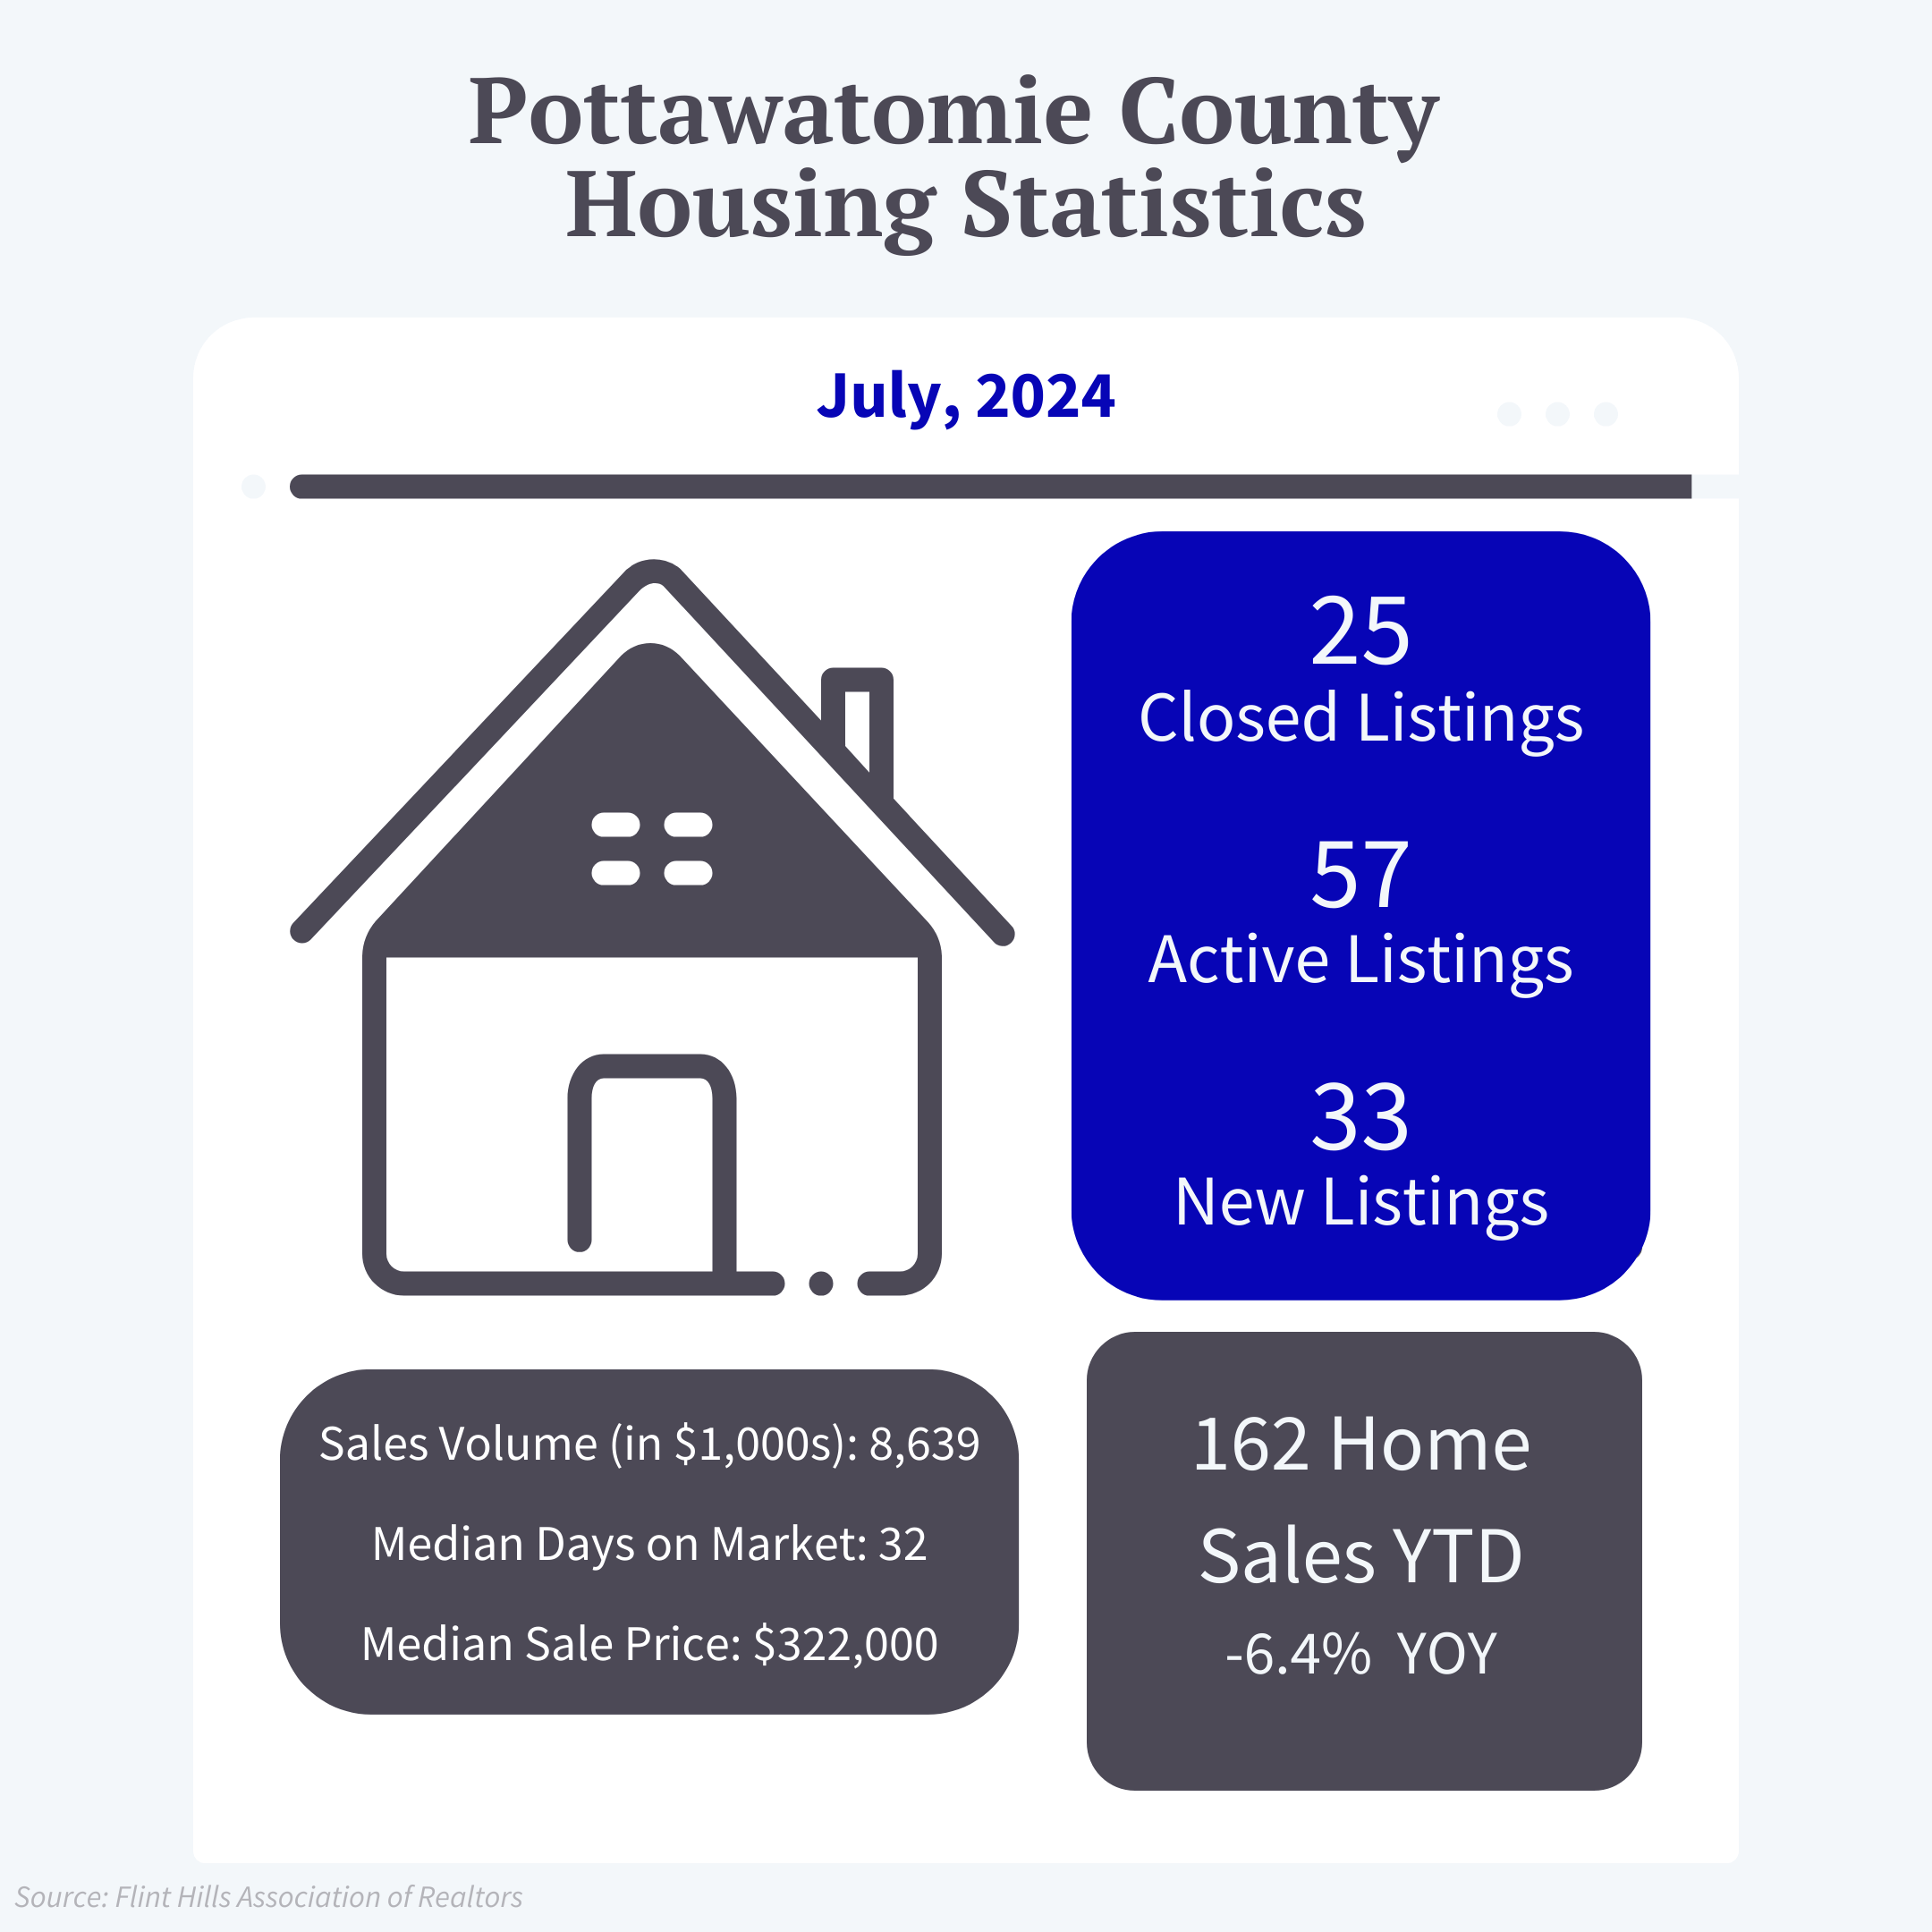
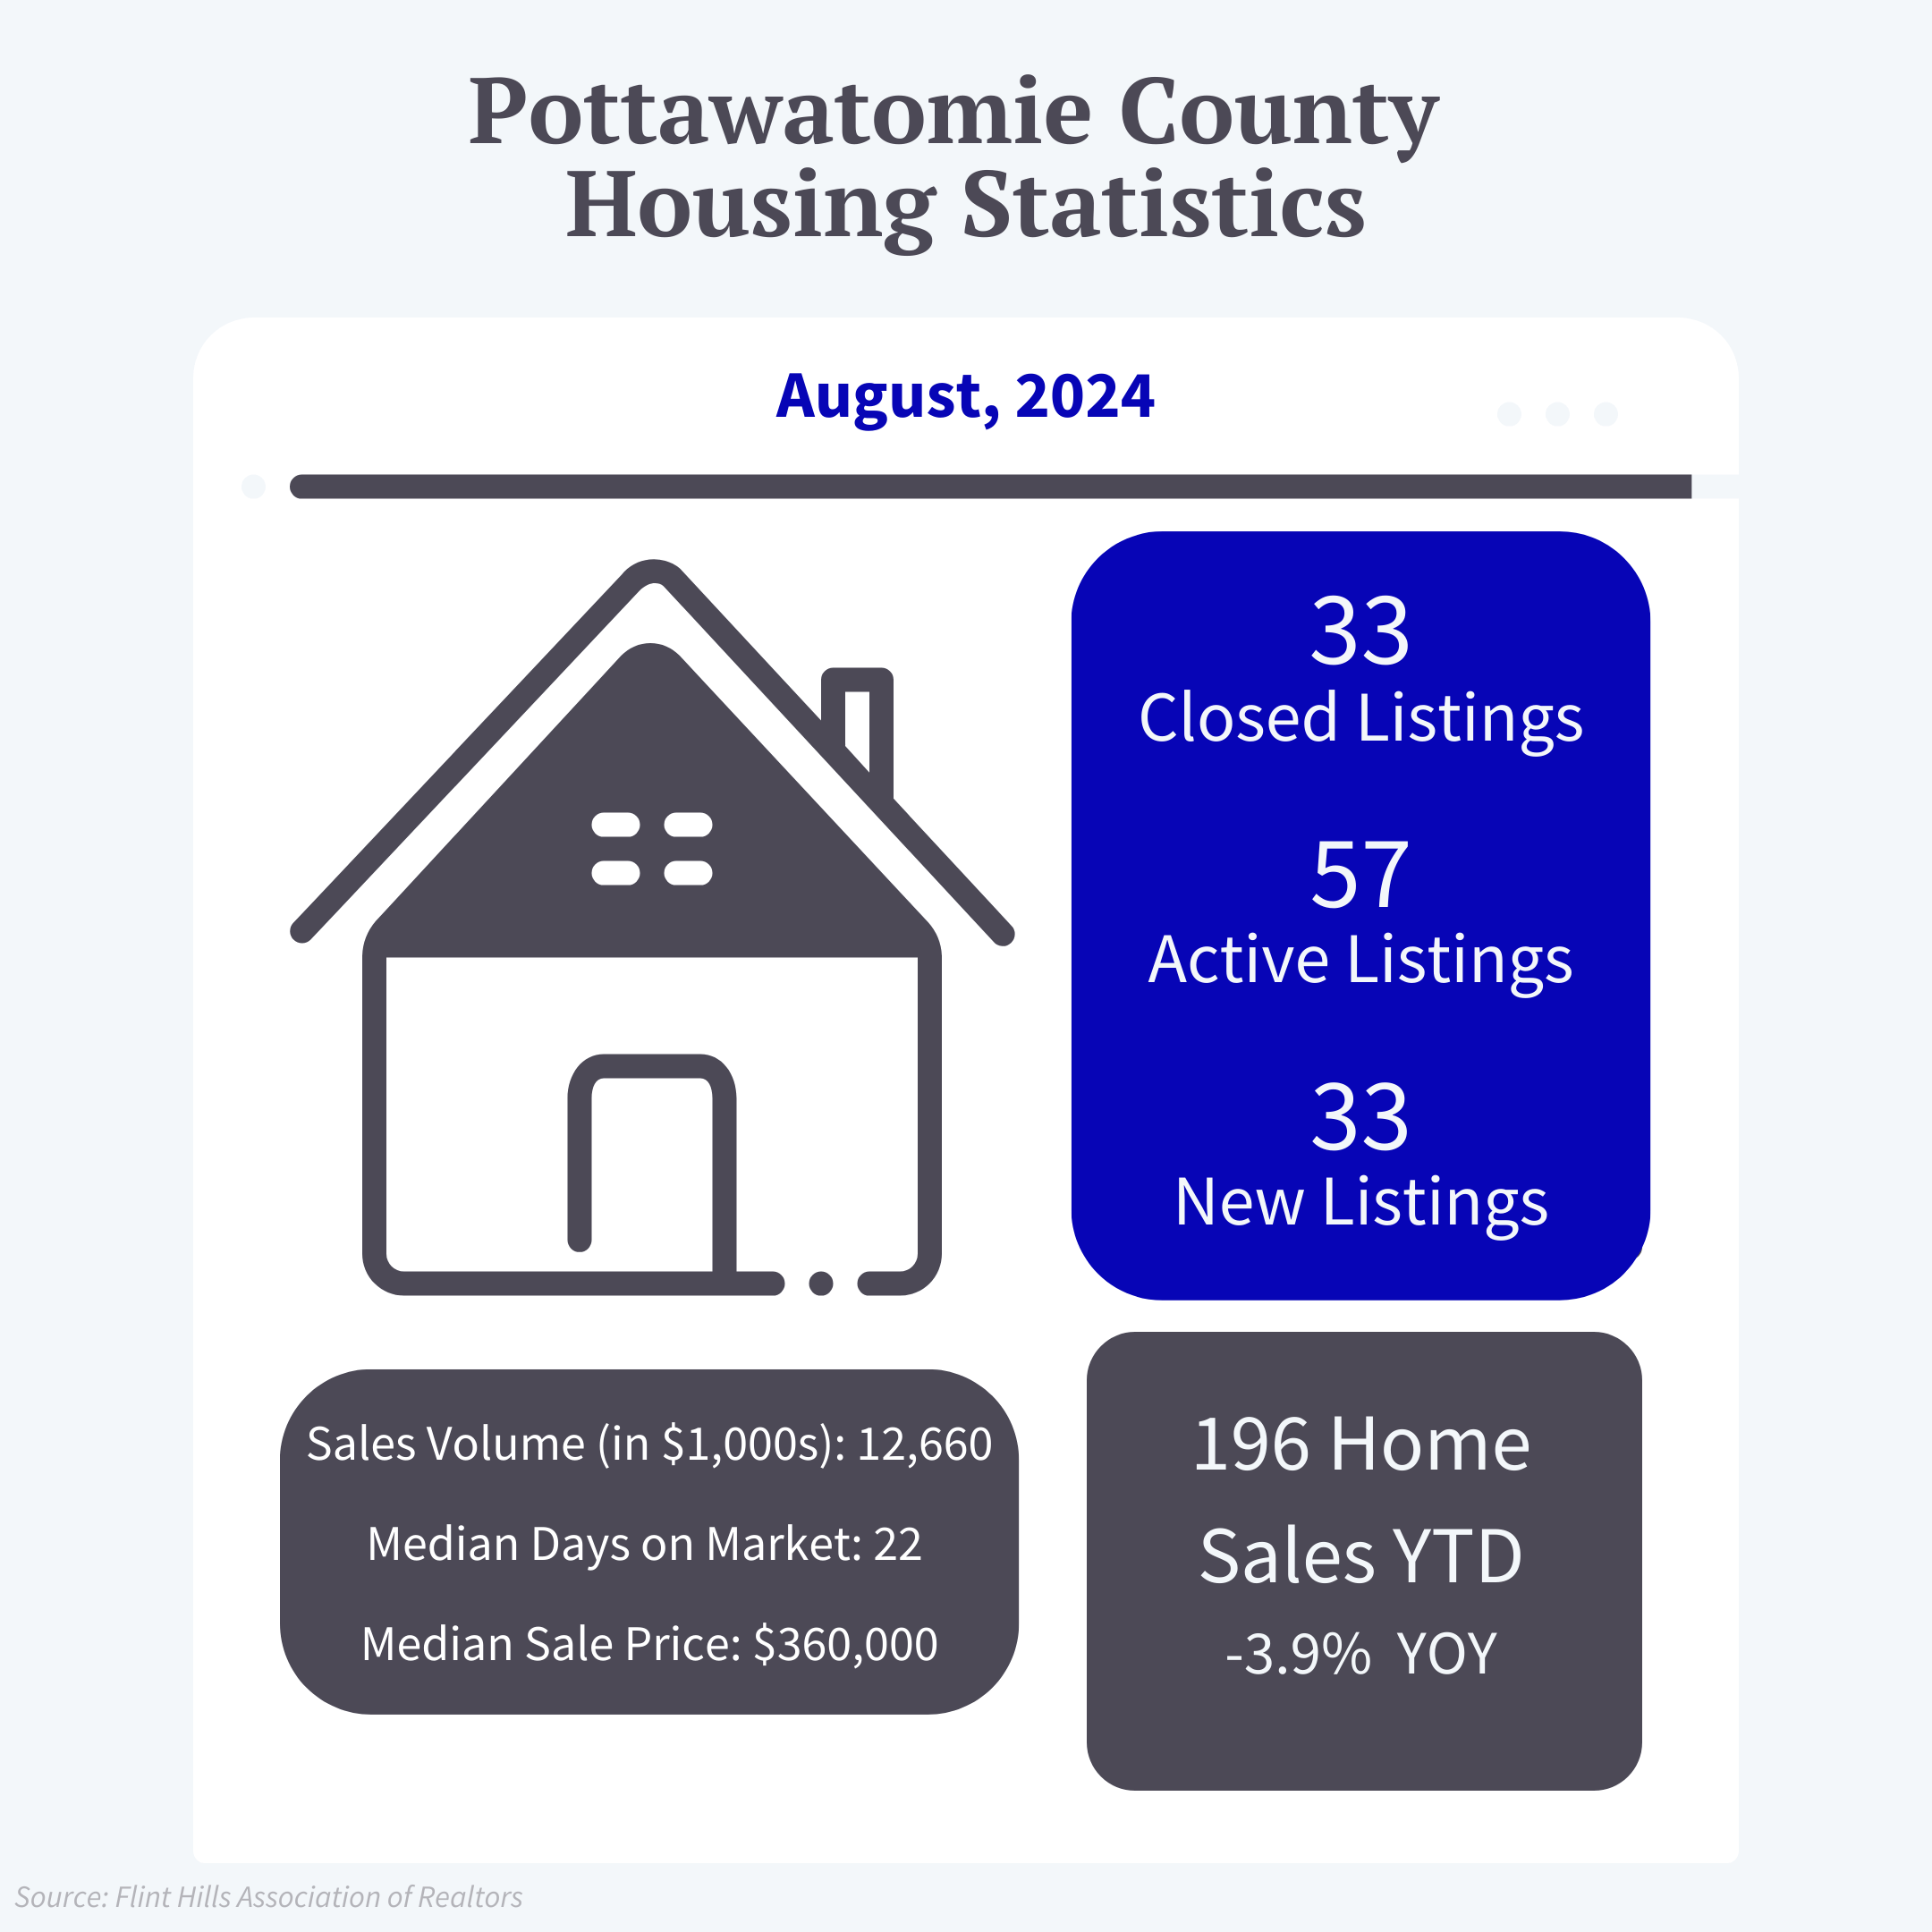
The number of home sales in Pottawatomie and Riley counties stayed within a similar range as last quarter, as did median home sales prices. While the area’s recent housing trends may hold few surprises, attainable housing remains a crucial piece of local workforce attraction and retention, as it is across the country. Housing affordability has become a widespread issue due to the impacts of a myriad of factors, including rising land, labor, and infrastructure costs, limited supply, migration trends, financing challenges, and speculative investment. With potential to impact a region’s ability to attract and keep workers, housing affordability has become a major topic of discussion with economic development agencies, and is increasingly seen as crucial to economic stability, even as high property valuations help boost local tax bases (at least in the short-term).
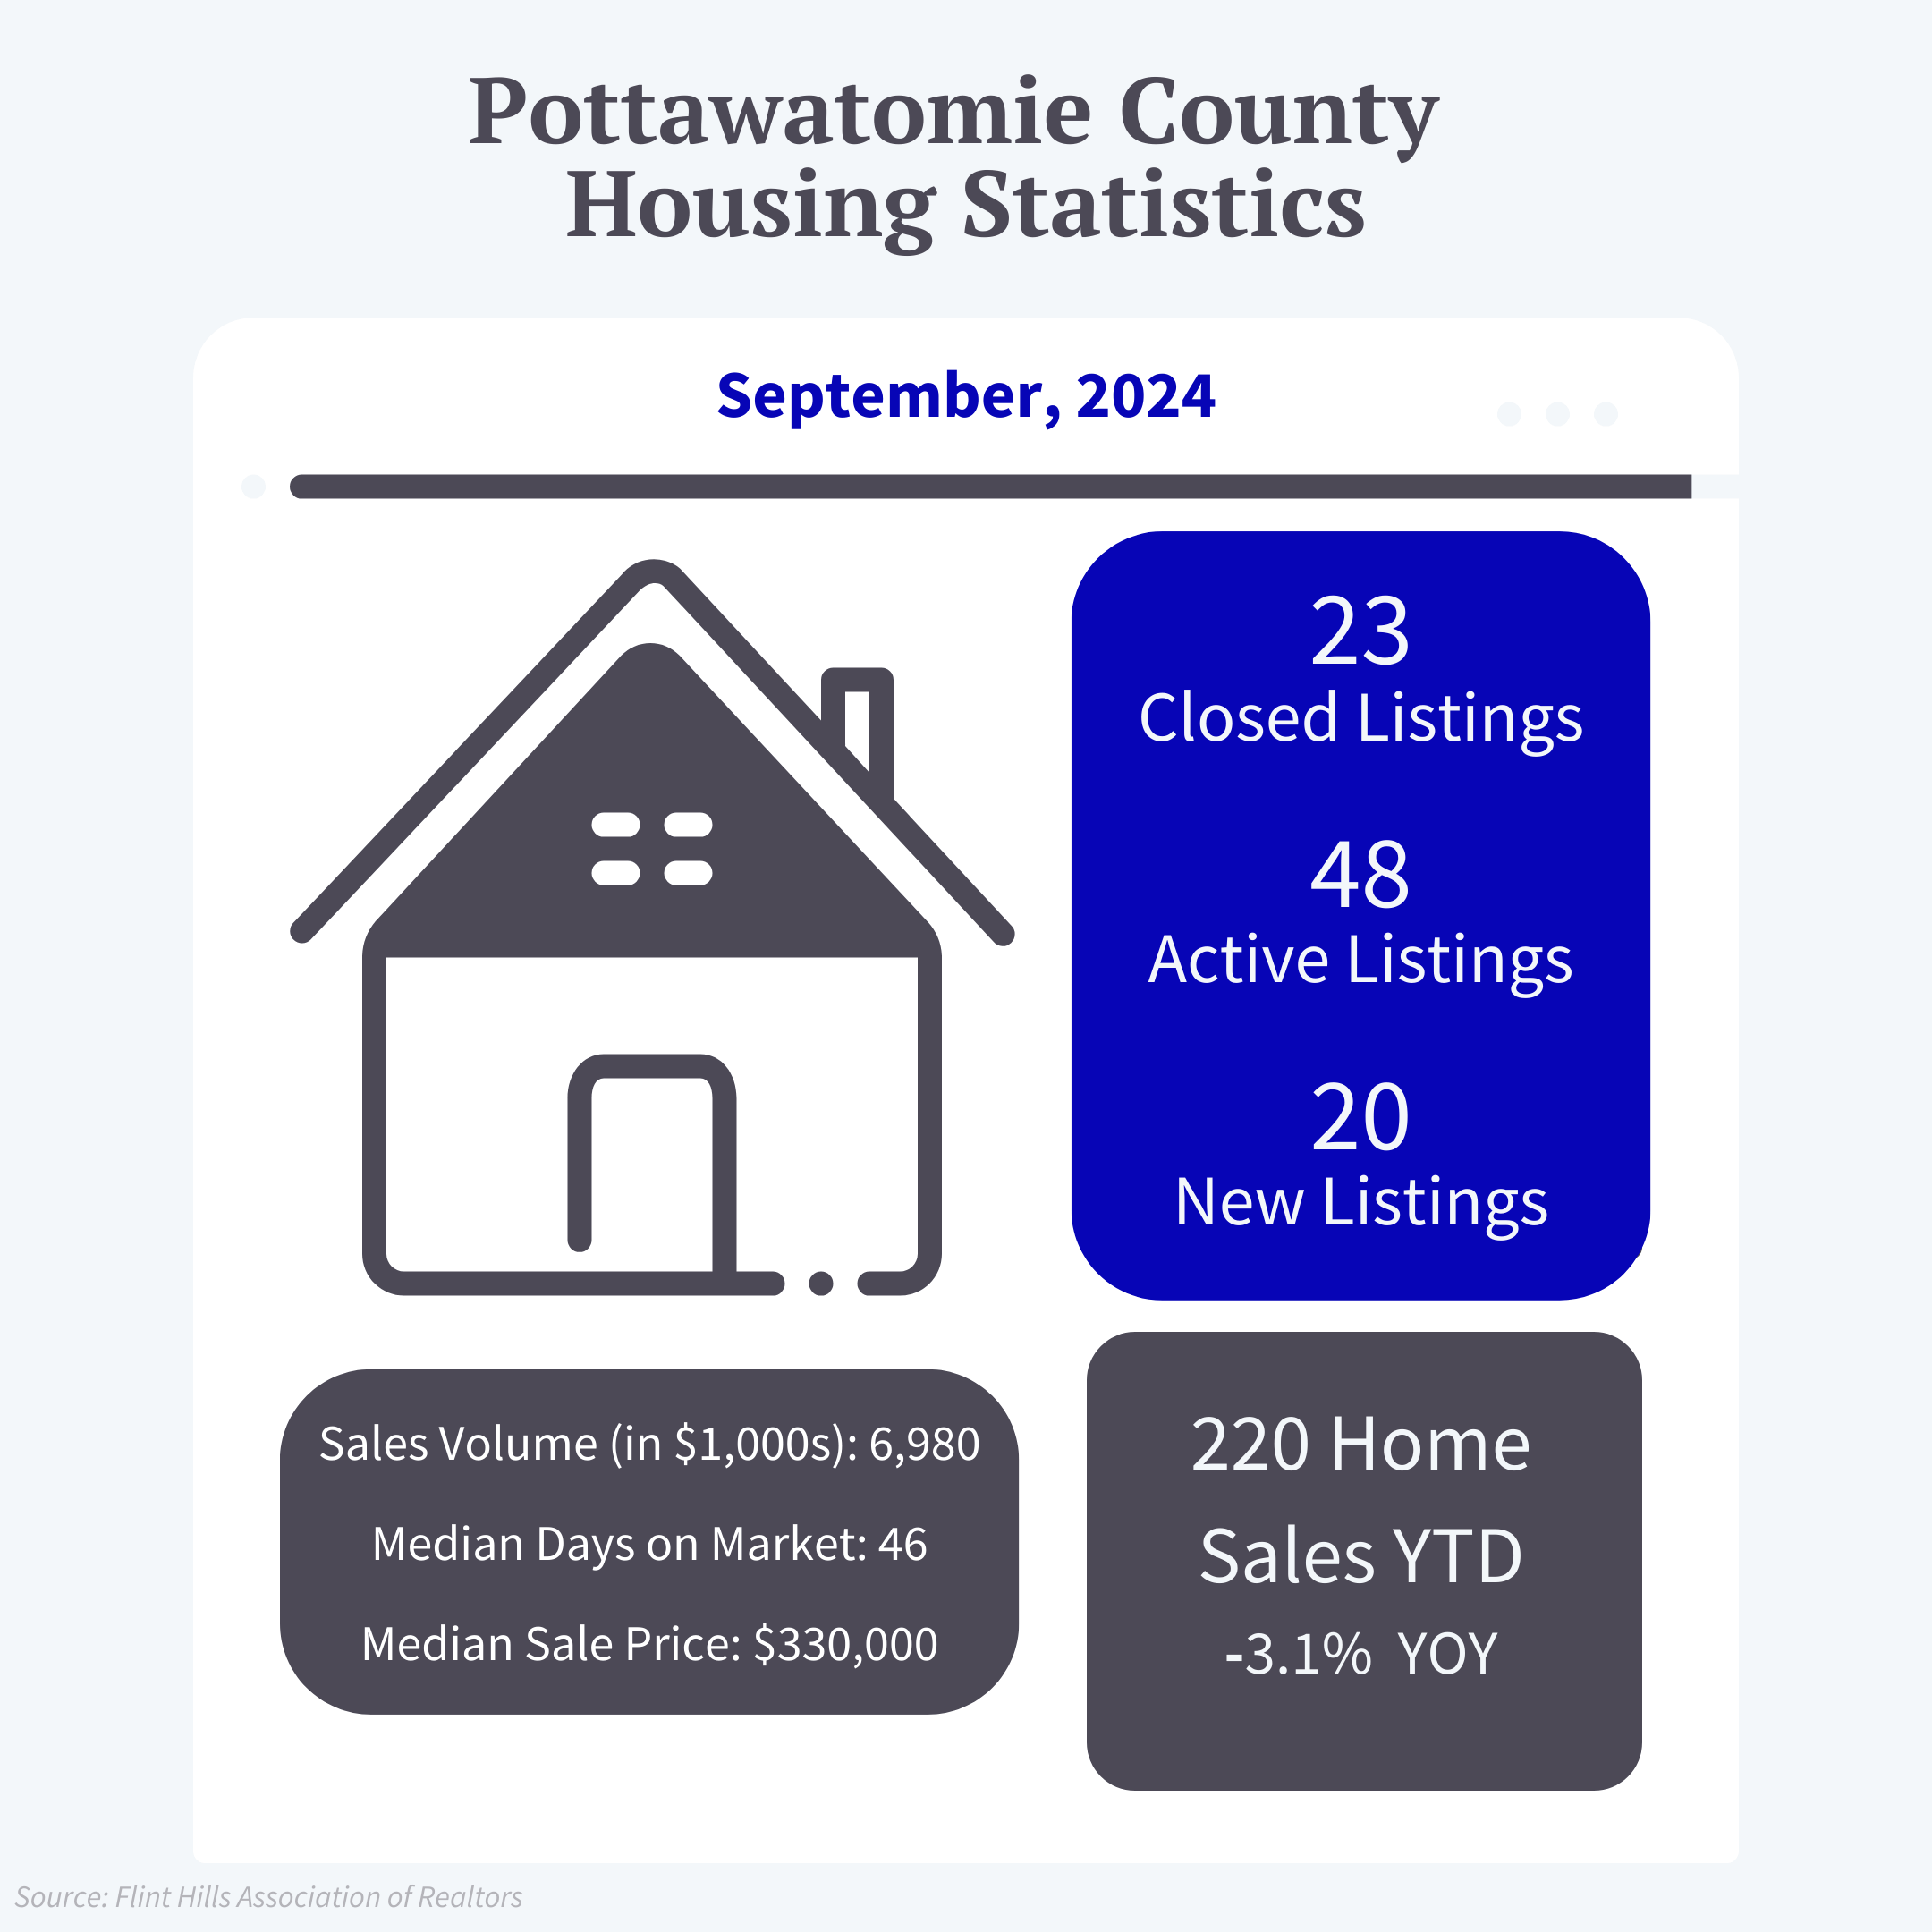
While Pottawatomie County’s median home sale price ($330,000 in September) may not be notable within the national market, housing affordability remains an issue for average households faced with a range of other expenses, including childcare, commuting costs for those returning to work, and general living expenses. Comparatively, Pottawatomie County’s median home sale price often outpaces that of Riley County (see line chart below for time-series data in recent months) and the general region (according to numbers from the Flint Hill’s Association of Realtors’ recent Eight-County Jurisdiction Housing Report).
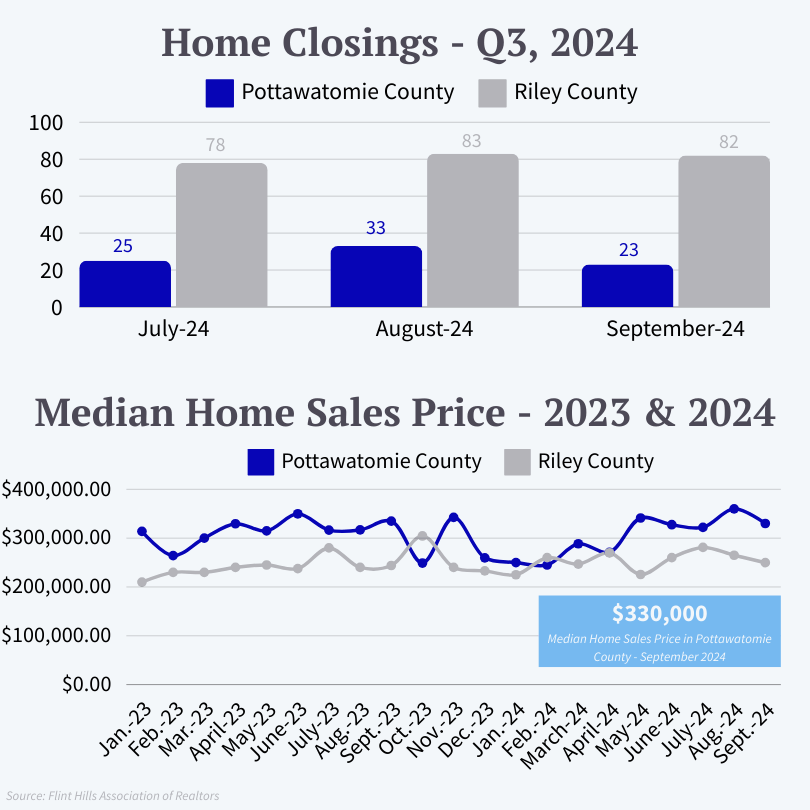
With Pottawatomie County’s year-to-date home sales totals reaching well over 200 by the end of quarter three, the county’s home sales are only slightly trailing those of last year. If recent years’ trends carry into 2024, we may expect to see some slowing in the number of home closings per month next quarter, and, potentially, even fewer home sales per month right at the start of 2025, as home sales tend to peak over the summer months.
National & Global Concerns
US Incomes on the Rise
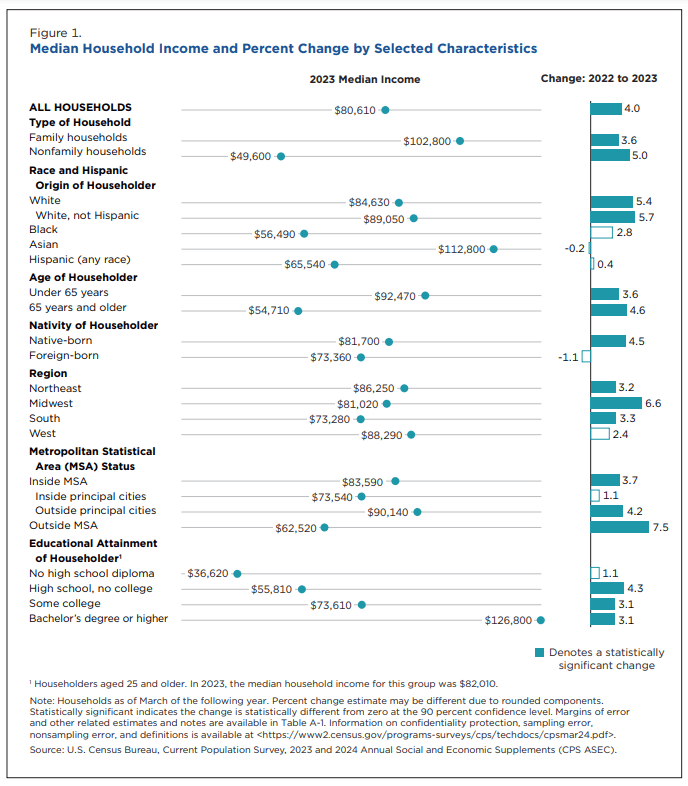
According to an excerpt from Sherwood News on the recent Census Bureau Report on Income in the United States: 2023, US household income rose by 4% last year, reaching a record high of record high of $80,610. This would be the biggest jump in inflation-adjusted incomes since 2019, although a great deal of the jump shown by this data comes from a slow-down in inflation rates, rather than a direct increase in incomes generated.
Understanding the National GDP
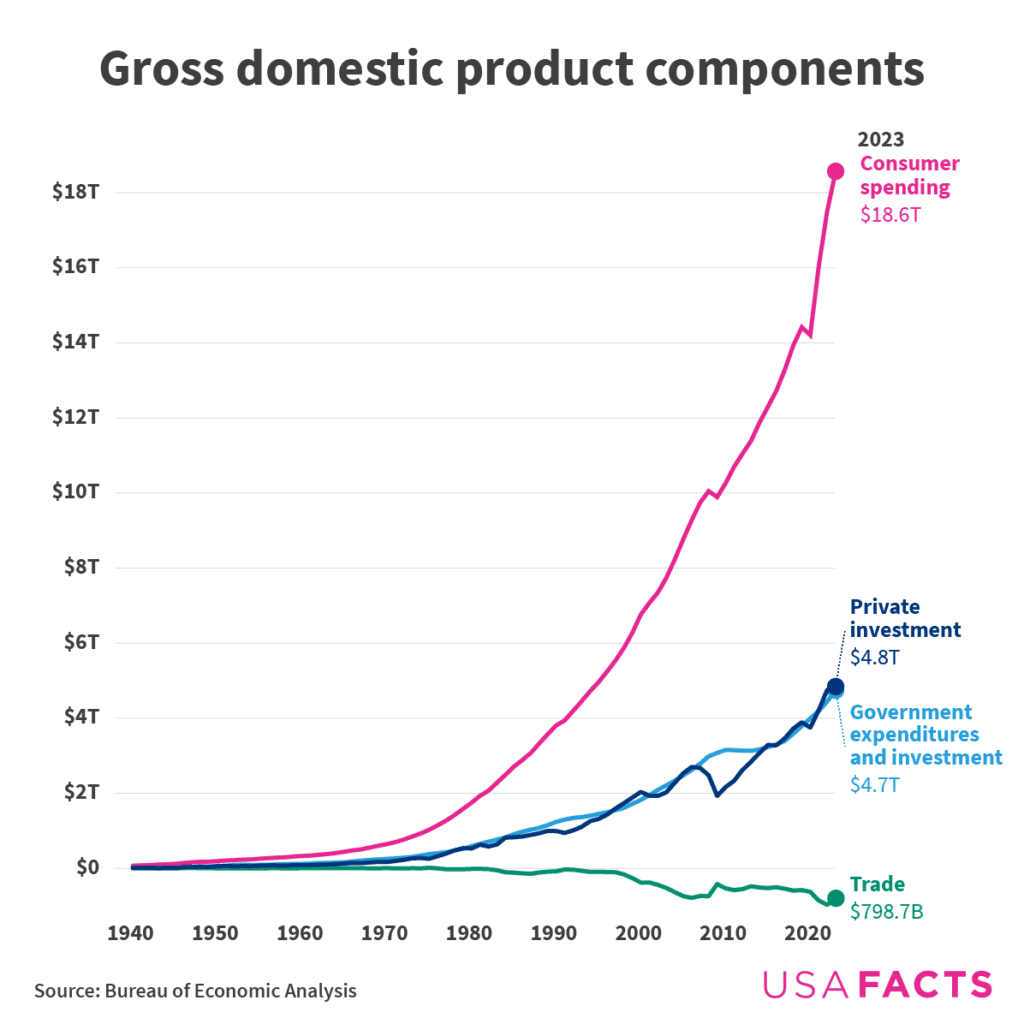
USAFacts reports that the national GDP, which is defined by the value of all goods and services produced in the American economy, rose 3.0% to $28.65 trillion in the second quarter of 2024. Over 65% of this total GDP comes from consumer spending on good and services, while investments and government spending each contribute another ~18%. Due to imports exceeding exports, trade accounts for around -3% of the recent GDP.
So, how does Kansas historically contribute to the national GDP? According to USAFacts’ reports on the Kansas economy, Kansas accounted for about 0.8% of the national economy, and had a GDP of $227.4 billion in the third quarter of last year.
New and Existing Home Sales
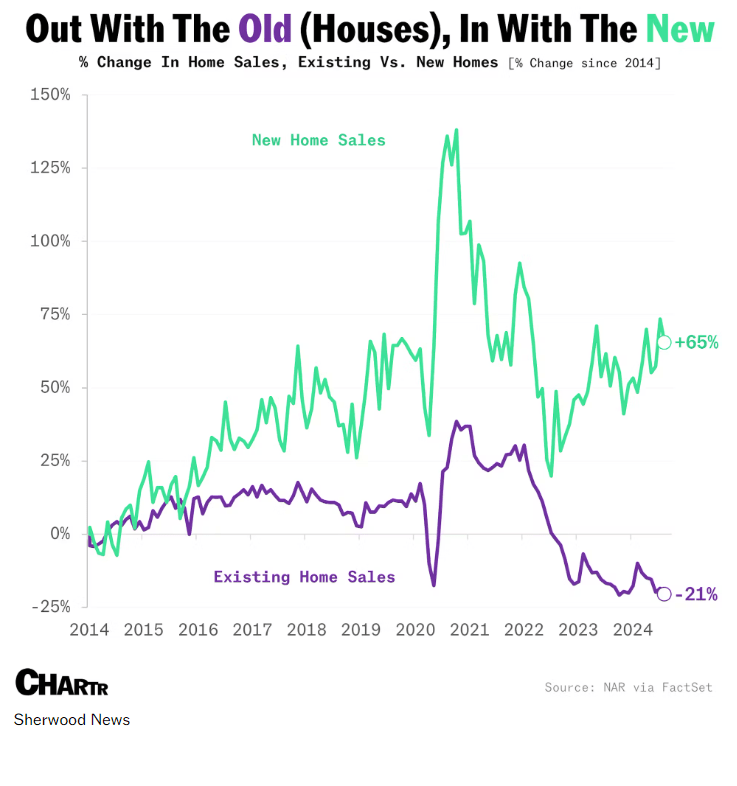
New home sales are up almost 65% (compared to the start of 2014), while existing home sales are down 21%, according to a recent article from Sherwood News. While this national data may provide evidence of a consumer preference towards new homes within the past decade, it also suggests that homeowners may be staying in their homes longer, rather than selling. Additionally, this trend may be influenced by discounts offered by new-build constructors, among other factors.
